usability research & writing
I worked with the Baymard Institute to research and author an e-commerce usability research report with 65 design guidelines.
Accounts & self-service study
Conducting the research
This Self-Service research was based on 185 test subject / site sessions of both moderated in-lab and remote qualitative testings following “Think Aloud” protocol along with a quantitative study of over 1,000 US adults.
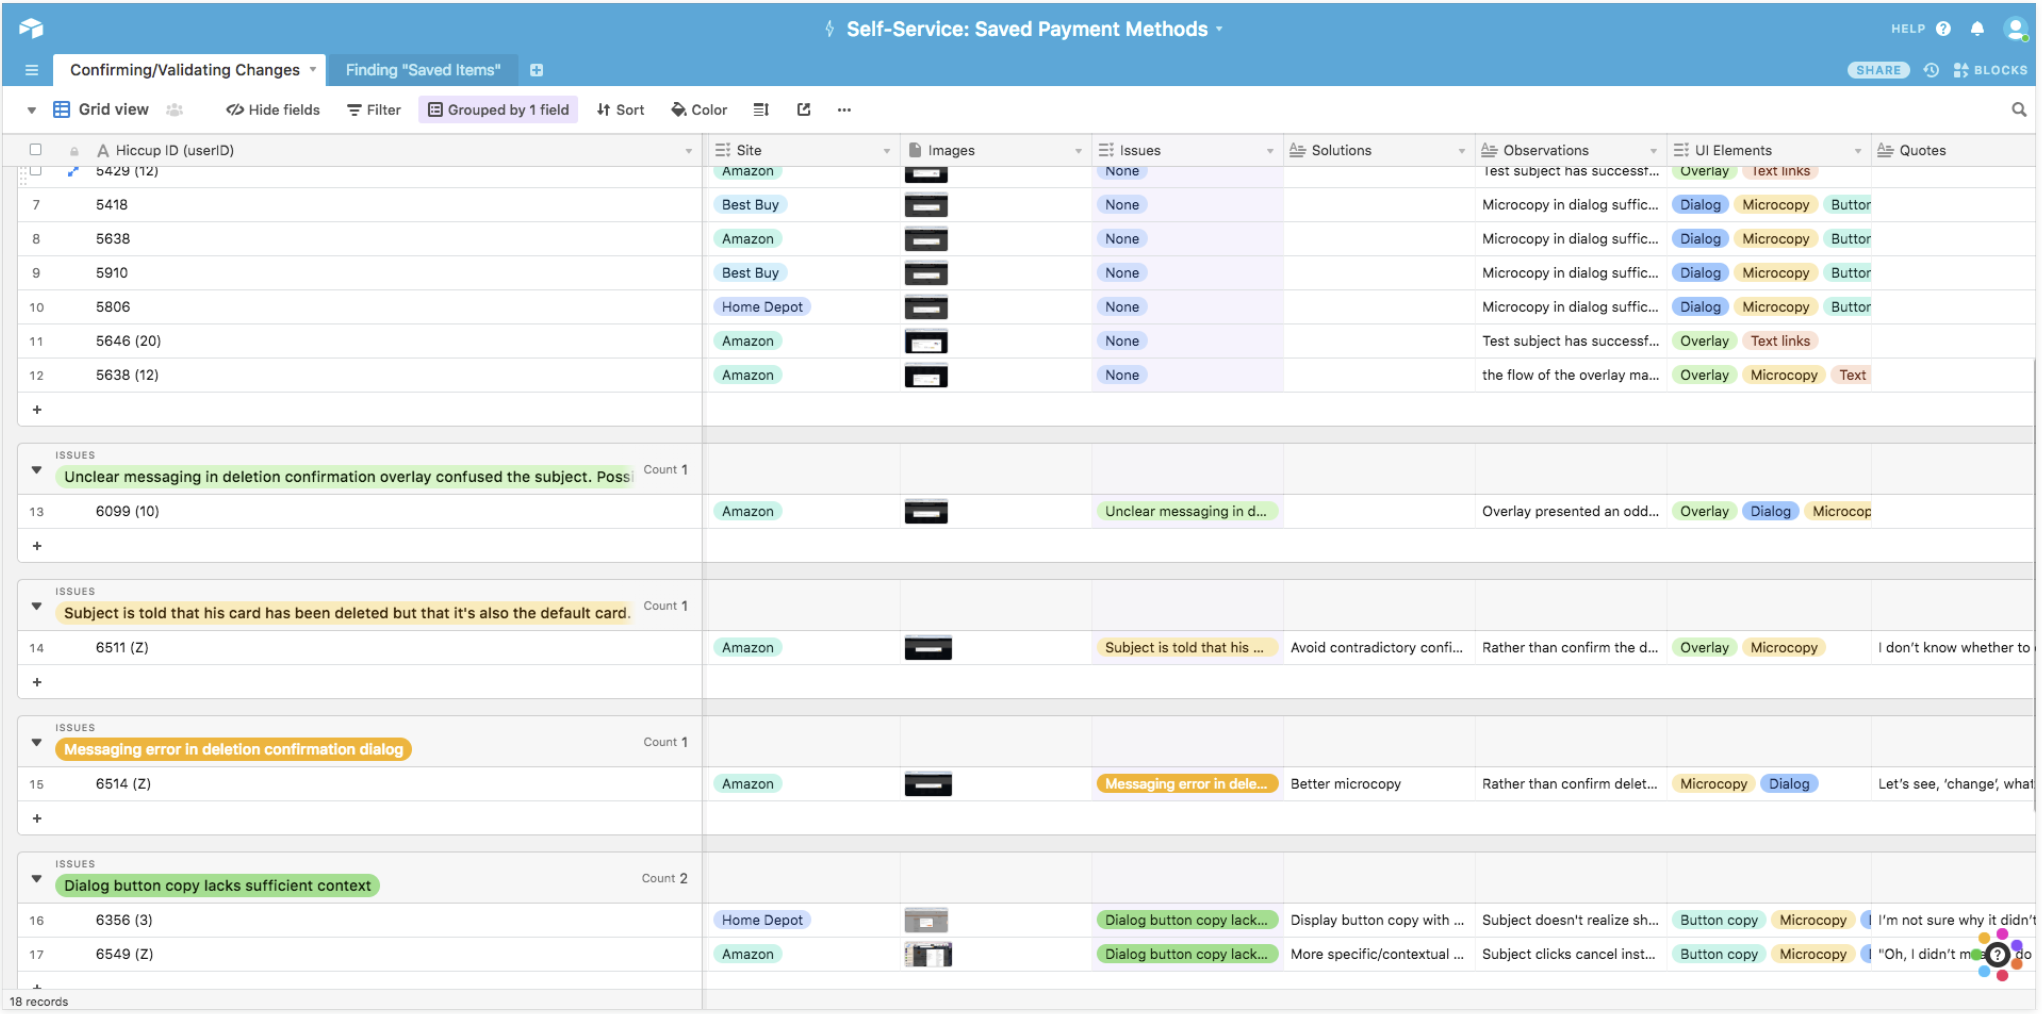
During usability testing, our test subjects encountered 1,400+ usability issues, shown here in a raw list of annotated sessions.
Analyzing usability issues
Historically, Baymard translated its raw usability testing data into grouped lists that were manually processed for structure.
Benefits of this approach:
Easy to add lots of notes and make comments
Structure is flexible
Easy to insert pictures
Command + F or “View Document Outline” for navigating back and forth
Can transition to writing without changing document types
Drawbacks of this approach:
Viewport glance = limited visibility into entire group of hiccups
E.g., You can only see what fits on the page, which is not always enough to easily identify patterns/trends
Results in a lot of scrolling up and down, trying to hold things in memory while looking for connections
There’s no way to sort or group the list types
E.g., It’s not possible to quickly see all UX implications groups together
Making connections between guidelines in a chapter requires jumping between documents
A new approach with structured data
I used Airtable to apply much-needed structure to Baymard’s unstructured data.
Content development
I then worked to translate the structured data into usability guidelines.
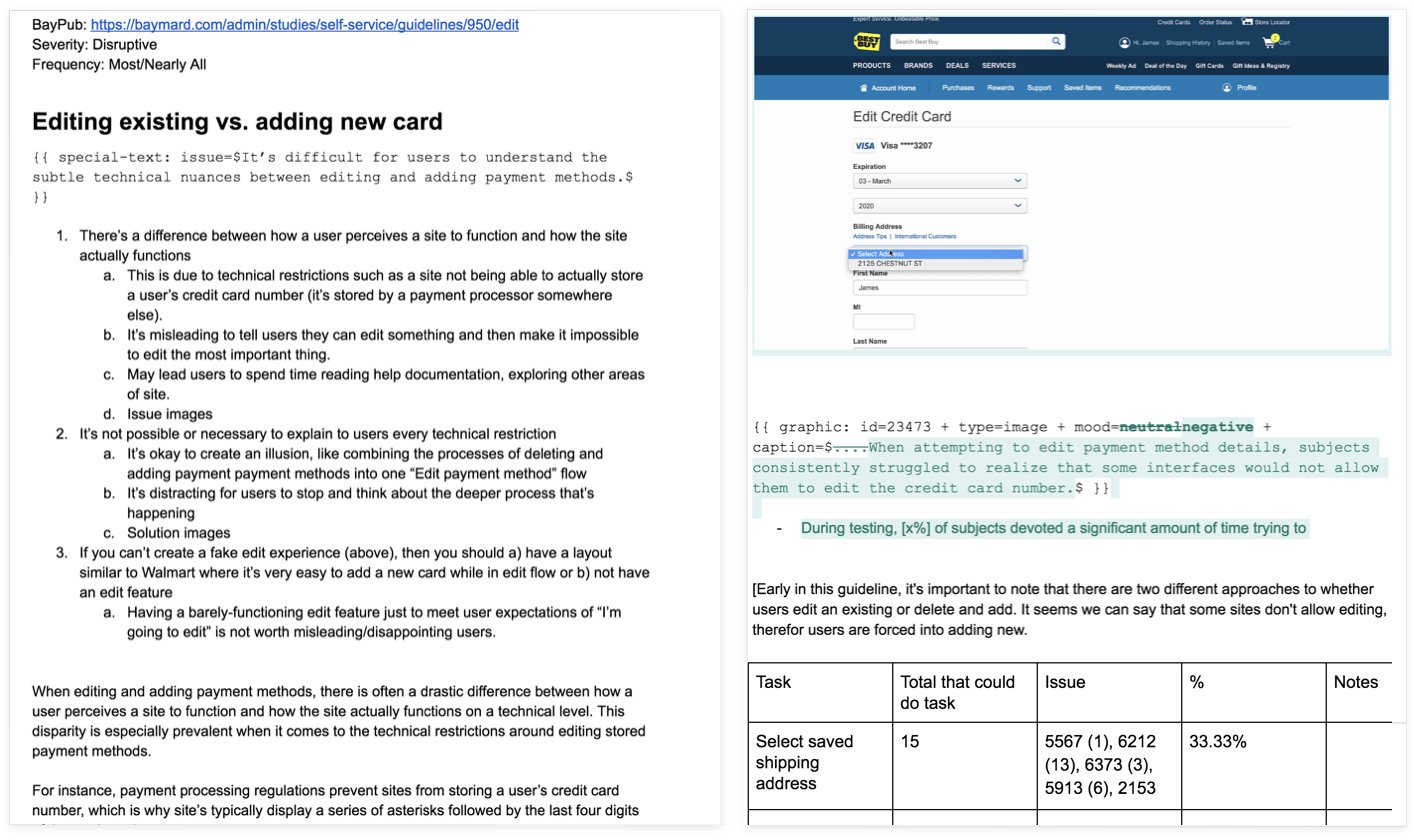
Initial drafts are quick and simple iterations with outlines, markdown, internal comments in brackets, and rough frequency calculations.
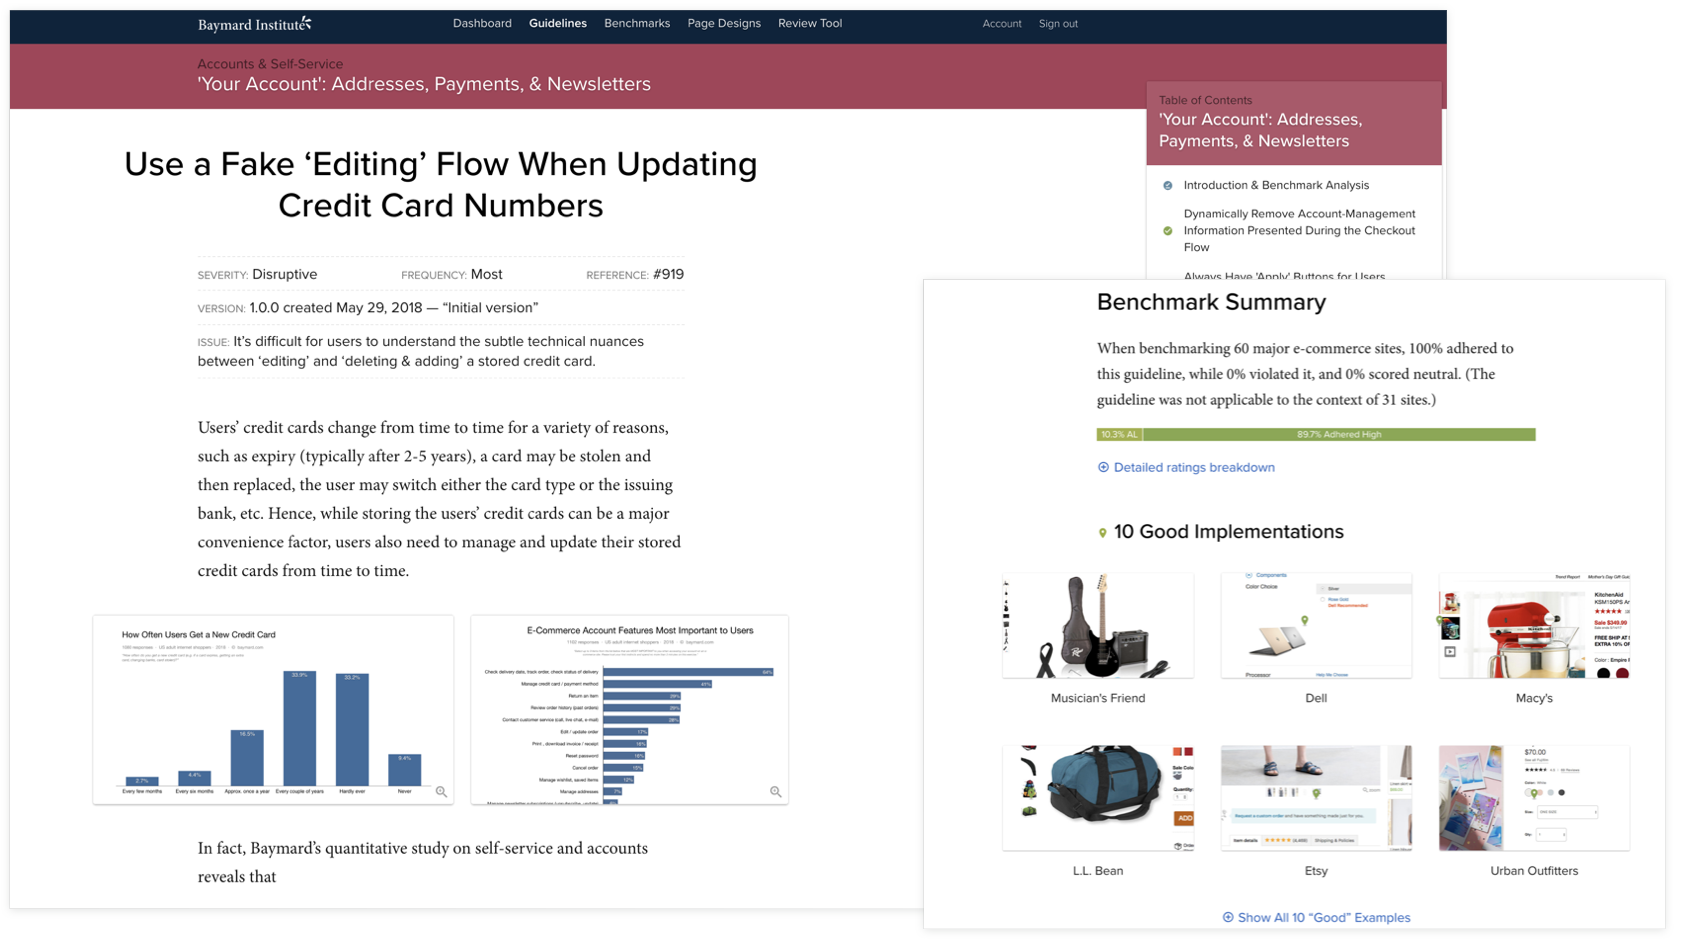
Final versions include quantitative figures, weighted and normalized frequencies and severities.